
You can’t possibly improve your call center operations, boost agent performance, and enhance your customer service quality unless you know what’s working well and what isn’t. Luckily, with robust call center reporting and analytics tools, you can track any call center metrics and KPIs and access a wealth of insights on almost everything that goes on in your call center. That’s how you can make more informed, data-driven decisions about the improvements that need to be made.
In this blog, we’ll talk about call center reporting, list some vital metrics you can track, outline the benefits of using call center reporting and analytics solutions, provide some examples of call center reports, and share the best practices on how to use contact center reporting tools effectively. Let’s get straight to the point!
What is Call Center Reporting?
Call center reporting is the process of capturing call center data from various data streams into easy-to-comprehend reports, typically presented in the form of charts or graphs. These data streams are coming from your ACD (Automatic Call Distributor), IVR (Interactive Voice Response), and WFM (Workforce Management) systems, among other sources.
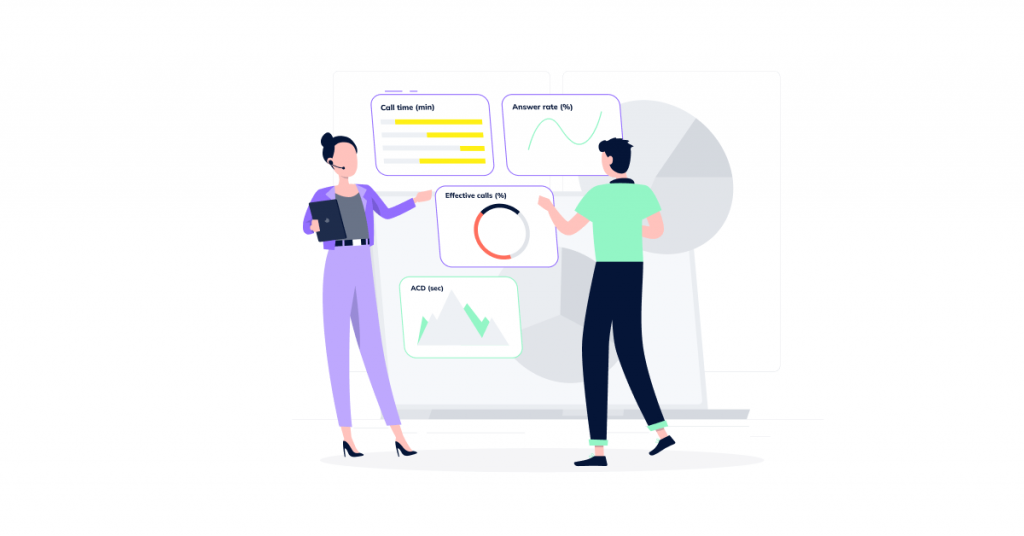
Call center reporting software basically converts raw data into actionable reports that call center managers can use to analyze call center performance and implement meaningful changes. Below are just a few call center metrics and KPIs (Key Performance Indicators) that you can track with call center reporting tools.
First Call Resolution (FCR)
First Call Resolution, also known as First Contact Resolution, helps you measure the ability of your team to resolve customer issues during one interaction. FCR is one of the most essential metrics you should be consistently tracking. Since having to contact a company over and over again while trying to get the same issue resolved often becomes a major source of frustration for customers, keeping an eye on your FCR and striving to improve it can significantly impact your customer satisfaction.
Average Speed of Answer (ASA)
Average Speed of Answer, also referred to as Average Wait Time, measures how long it takes on average for your incoming calls to be answered by your call center agents, starting from being placed in a call queue. That’s an important metric that literally shows how responsive your customer service team is. Tracking your ASA and keeping it as low as possible helps reduce the call abandonment rate and improve customer satisfaction and CX.
Average Handle Time (AHT)
Average Handle Time is another must-have metric to keep close tabs on. AHT measures the average time it takes for an agent to resolve a customer’s issue, including the actual talk time, hold times, transfer times, and After-Call Work (the time an agent spends or any related follow-up activities). Reducing AHT would typically result in increased customer satisfaction, improved agent performance, and reduced call center costs.
Call Abandonment Rate
Call Abandonment Rate shows the percentage of inbound calls terminated by customers before being connected to a service agent. Naturally, a high Call Abandonment Rate would indicate that there aren’t enough agents to handle your inbound call volume. That’s how you know you might need to adjust your staffing levels and, perhaps, implement a queue callback option, enabling your customers to simply request a return call instead of having to wait on hold.
Customer Satisfaction Score (CSAT)
Customer Satisfaction Score helps you measure how satisfied your customers are after interacting with your customer service representative. Measuring CSAT regularly and consistently enables you to better understand whether your team is meeting your customer expectations and shows you whether your reps require additional training and coaching. And what’s more, by including open-ended questions in your CSAT surveys, you can capture valuable customer feedback along with simply tracking a CSAT score.
Service Level
Service Level measures the percentage of customer calls answered within a given time frame. For most call centers, the rule of thumb would be 80/20, which means 80% of inbound calls get answered by your reps within 20 seconds. Of course, the higher the percentage, the better. Measuring your Service Level will keep you informed on whether your call center is properly staffed to handle your inbound call volume.
Agent Utilization
Agent Utilization rate is one of the most critical agent productivity metrics that shows the percentage of time your call center reps are handling customer calls and performing post-call related tasks and other productive activities out of their total available time. Call center managers should consistently track this metric to better understand how effectively their team members are using their working hours.
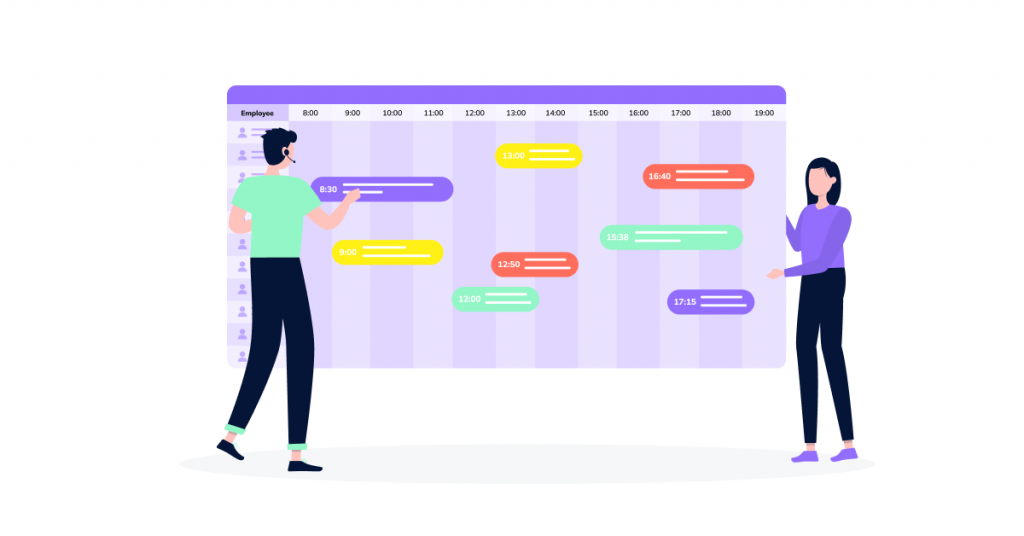
Schedule Adherence
Schedule adherence is another important agent productivity metric to keep track of. It is the percentage of time your call center agents follow their assigned schedules, including lunches, breaks, training and coaching, and other activities. Ensuring that your reps adhere to their schedules is essential to a smooth transition between shifts. High adherence also helps ensure that customer calls are handled on time, which contributes to greater customer satisfaction.
Call Answer Rate
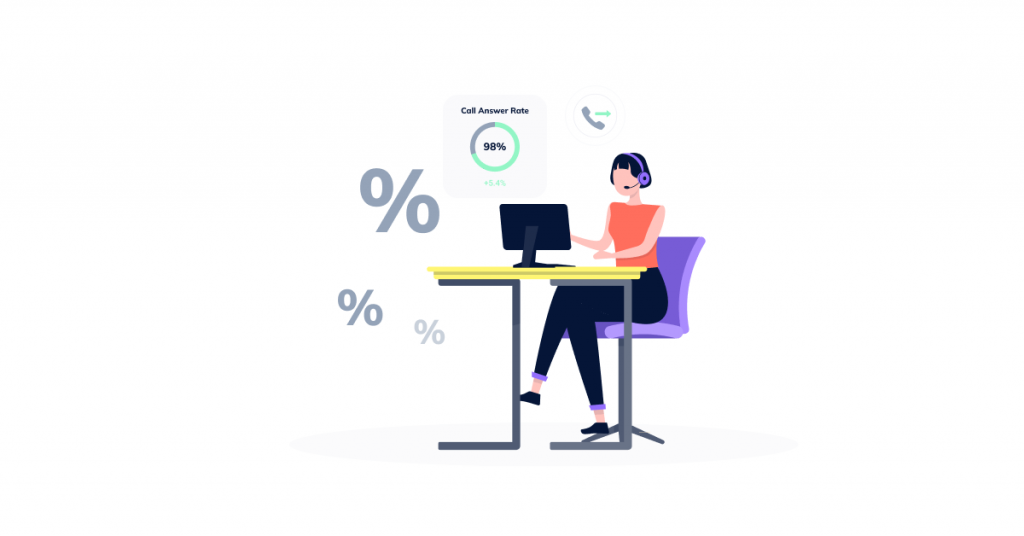
For outbound call centers, there would be a different set of metrics and KPIs to track. If your team is using auto dialer software for call center to make outbound calls for lead generation or outbound sales, Call Answer Rate is the one you should be measuring each time you are running outbound calling campaigns. It shows the percentage of attempted outbound calls that are answered by your prospects or customers – and that’s how you can evaluate the effectiveness of your outbound calling efforts.
Call Center Reporting vs. Analytics: What is the Difference?
Though call center analytics and reporting go hand-in-hand in call centers (and these are usually part of inbound or outbound call center software solutions), the two terms do not mean exactly the same thing. So what’s the difference anyway? Collecting data and generating call center reports with your most critical metrics and KPIs is only the first step of analytics, helping you evaluate the current state of things in your call center.
Simply put, reports help you understand what’s working well within your call center and where your KPIs are below the benchmarks. Analytics, on the other hand, uses historical and real-time data to provide a deeper insight into what’s happening and why, helping you identify trends and patterns and predict future outcomes so you can make more informed decisions about improvements. Below, we’ve broken down the key differences:
| Call Center Reporting | Call Center Analytics | |
Definition | Turns raw data into understandable reports that show key metrics and KPIs. | Identifies patterns and trends in the call center data presented through reporting. |
Objective | Helps you understand how your call center operations are performing. | Helps you understand why you are getting the results you see so you can make informed improvements. |
Output | Graphical data representation through charts/ tables/ graphs. | Actionable insights and improvement suggestions. |
Why are Call Center Reports Important? Key Benefits of Call Center Reporting and Analytics
Using reporting and analytics tools can truly bring a wealth of benefits to call centers and contact centers. No wonder the global contact center analytics market size is anticipated to grow from USD 1.63 billion in 2023 to USD 5.75 billion in 2030, according to a report by Grand View Research. Let’s take a closer look at some of the key benefits:
Improved customer service and CX
With 84% of consumers claiming the experience a company provides is as important as its products and services, according to Salesforce, businesses should use every opportunity to improve their service operations. Otherwise, customer satisfaction will suffer, impacting customer retention, sales, and revenue. With reporting and analytics tools, you’ll know exactly whether your support team is meeting your customer expectations and how your customers perceive the quality of your service. Based on that knowledge, you’ll be able to make targeted improvements, enhancing your customer service and customer experience.
Increased agent efficiency

Highly efficient and productive agents are a dream for any manager. Reporting and analytics solutions enable call center managers to track agent activity and measure their actual performance through metrics like the number of calls handled, average handling times, FCR rates, call escalation rates, after-call work, and many more. Not only does it help you identify top-performing agents (and hopefully reward them for excellent performance), but you can also spot training opportunities and then coach your reps to help them improve their efficiency and productivity.
Reduced call center costs
In addition to all of the above, call center reporting and analytics features of call center software solutions enable you to improve your call center operations and increase call center performance while also reducing your overall call center costs. Here’s a simple example. If you notice your FCR rate is getting lower, focusing on improving this metric can actually help you reduce your call center costs. How? When the majority of customer issues are successfully resolved on the first call, that reduces the number of repeat calls and the overall inbound call volume, which naturally reduces your cost per call.
Better forecasting and resource planning
Finally, call center reporting and analytics tools can help managers with better forecasting and resource planning. By getting access to and analyzing historical data on call volumes, peak hours, and call volume trends, you can make more accurate forecasts about the expected call volumes, determine your staffing requirements, and optimize agent schedules. The outcome? Minimized wait times for customers (meaning fewer frustrated callers), improved service levels, and increased CSAT scores.
Examples of Call Center Reports
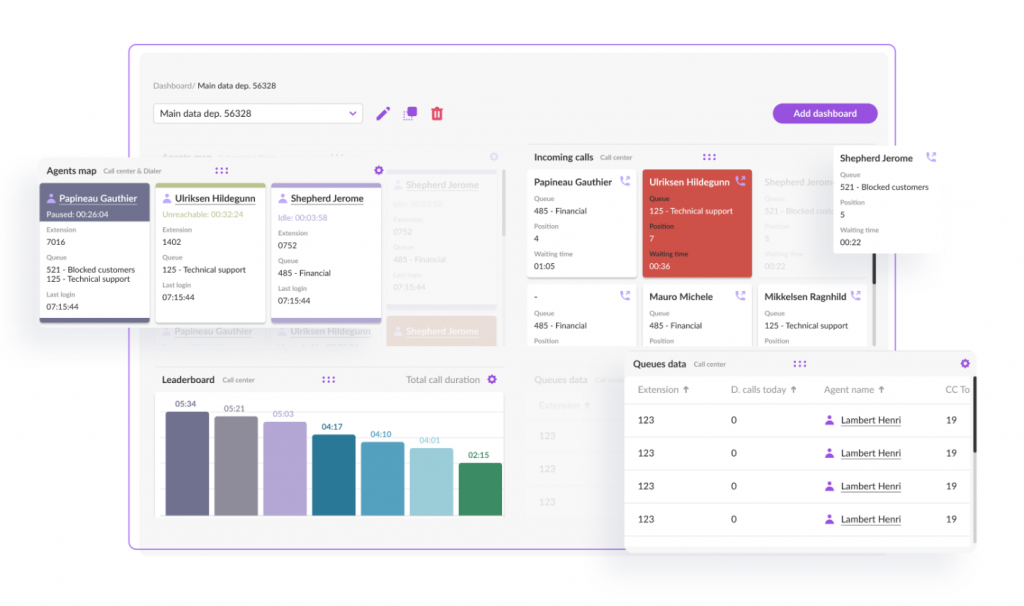
Different call center software providers have different reporting and analytics capabilities. E.g., with VoiceSpin, you can generate pre-built and custom reports to measure just about any aspect of your operations and team’s efficiency. Let’s now take a look at the various types of reports you can generate with call center reporting tools and what valuable insights you can get from them:
Agent status reports
Agent status reports (also known as agent availability reports) usually display a daily breakdown of the time an agent spends in the system and helps you track productivity and schedule adherence. E.g., you can track the amount of time an agent remains logged on, the time an agent spends on queue and off queue, the time an agent spends interacting with customers, and in the idle status, etc.
Agent activity reports
This call center report would typically give you an overview of each agent’s activity. It may include metrics like the total number of incoming calls handled by an agent, the average talk time, the average wrap-up time (after-call work), the number of transferred calls, etc. Agent activity reports and often combined with agent status reports, providing managers with complete insights into how effectively agents are using their time.
Call detail reports
These types of reports would commonly list all the key information of every inbound or outbound call. E.g., for inbound calls, it would provide details about the number that was dialed (referred to as Dialed Number Identification Service or DNIS), where the call originated from, the date and time the call started and ended, if the call was routed to a queue, the total duration of the call, the status or disposition of the call (answered, rejected, abandoned in queue, etc.).
Call direction reports
Call direction reports give you an overview of the number of calls made or received by your team over a specific period. They may include the total number of inbound calls, the total number of outbound calls, the total number of internal calls made to other departments, as well as details like total call duration, average call duration, maximum call duration, etc.
Queue activity reports
Queue activity reports enable you to assess the performance of your configured call queues. With these types of call center reports, you can track the total number of calls that entered each specific queue, the total number of calls answered by agents and abandoned while waiting in the queue, the average time callers waited before being connected to an agent, and the percentage of calls in each queue accepted within your service level.
Best Practices for Efficient Call Center Reporting
Call center reporting and analytics tools work best when used intelligently and strategically. To ensure you get the maximum benefit from call center reporting, follow these best practices:
Define your most critical metrics and KPIs
With tons of inbound and outbound call center metrics and KPIs out there, it would be too overwhelming and time-consuming to track as many of them as possible. Instead, you should narrow down your focus and measure only those that are relevant to your call center’s goals and objectives. For example, if you prioritize customer satisfaction above all else, the metrics and KPIs you should pay close attention to are First Call Resolution (FCR) rate, Call Abandonment Rate, Average Handle Times, Customer Satisfaction Score (CSAT), and Customer Effort Score (CES).
Set realistic metrics goals and objectives
When setting metrics goals and performance targets for your teams, make sure these goals are realistic and achievable, otherwise, it might only demotivate your agents instead of inspiring them. On top of that, don’t fall into the trap of setting conflicting performance goals. For instance, if you aim to increase your First Call Resolution Rate while also reducing the Average Handle Time simultaneously, think of how confusing it would be for your agents to prioritize between these two metrics every time they interact with customers.
Know the call center industry benchmarks
Knowing the industry benchmarks for different call center metrics and KPIs is what can help you set realistic goals for your teams and ensure that your call center performance aligns with the industry standards and that your call center is on par with competitors. E.g., while the commonly accepted industry standard for a good FCR rate falls within a range of 70-79%, if your FCR rate is below these numbers, your customer satisfaction and customer experience might suffer because your FCR rate is lower than that of your competitors.
Use advanced call center reporting software
To get the maximum value out of your call center data, look for a contact center reporting and analytics tool that has a user-friendly, intuitive interface to ensure it’s easy for your agents and managers to use, comprehend the data, and analyze your metrics and KPIs. Real-time dashboards to track metrics in real-time and an ability to generate custom reports for the specific KPIs that matter to your call center are also among the must-have features to look for in your call center reporting tool.
Leverage Call Center Reporting and Analytics with VoiceSpin
You can’t effectively measure your call center performance without proper call center reporting and analytics tools in place. With call center solutions like VoiceSpin, you get advanced built-in reporting and analytics capabilities alongside a bunch of other inbound and outbound call management features. In addition to the ability to generate out-of-the-box and custom contact center reports and track your most vital metrics and KPIs, you can get even deeper insights from AI Speech Analyzer that helps assess agent performance and measure sentiment analysis, among other things.
Book a demo call now, and one of our sales reps will give you a personalized walkthrough of VoiceSpin’s AI contact center solutions and help you better understand how you can leverage them to improve your contact center operations, enhance CX, and boost your team’s efficiency.


 +18889082995
 +442036084160
 +97237237006
 Call on WhatsApp

